Rent Report, June 2021: The State of the Rental Market

As vaccinations continue, travel picks up and policy efforts continue to direct support at consumers who have been hurt by the COVID-19 economy, rent trends are evolving across the country. Let’s look at where rent prices stand today compared to one year ago.
National average rent price trends
On a national level, we’re noticing a shift in recent patterns. One-bedroom apartments remain in high demand since last month, while studios and three-bedroom units are declining in popularity.
- 0-BR: $1,641 (+0.6 percent from prior month / -3.1 percent year-over-year)
- 1-BR: $1,711 (+2.9 percent from prior month / +5.2 percent year-over-year)
- 2-BR: $1,972 (+1.9 percent from prior month / +4.8 percent year-over-year)
- 3-BR: $2,012 (-2.8 percent from prior month / -1.4 percent year-over-year)
State average rent price trends
As we look at what rent prices are doing from state to state, we see that studios, one-bedroom and two-bedroom apartments have almost equal changes in rent price trends. All three unit types saw rent prices increase in 60 percent or more of states.
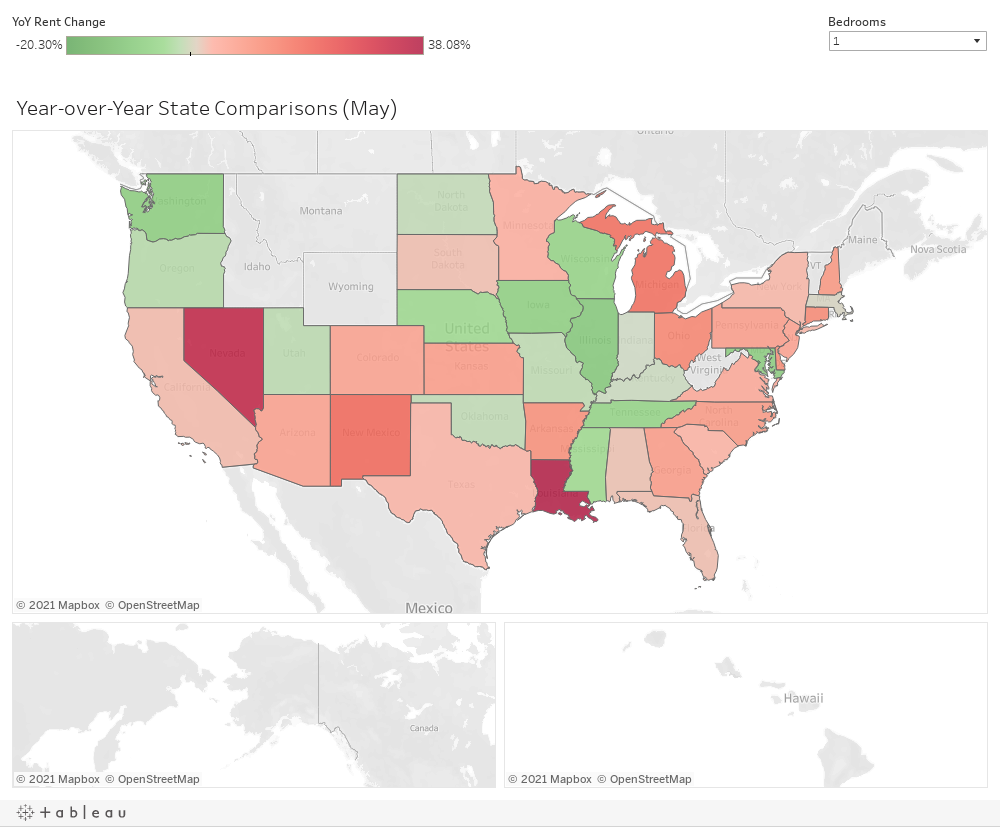
Three-bedroom apartments, on the other hand, saw a major decrease, with more than half of states reflecting lower rent prices compared to one year ago.
We excluded the bottom 15 percent of our rent price data at the state level when running these calculations to eliminate areas with lower inventory. Of the remaining states:
- 0-BR: 62 percent of states are up and 38 percent are down
- 1-BR: 62 percent of states are up and 38 percent are down
- 2-BR: 67 percent of states are up and 33 percent are down
- 3-BR: 42 percent of states are up and 58 percent are down
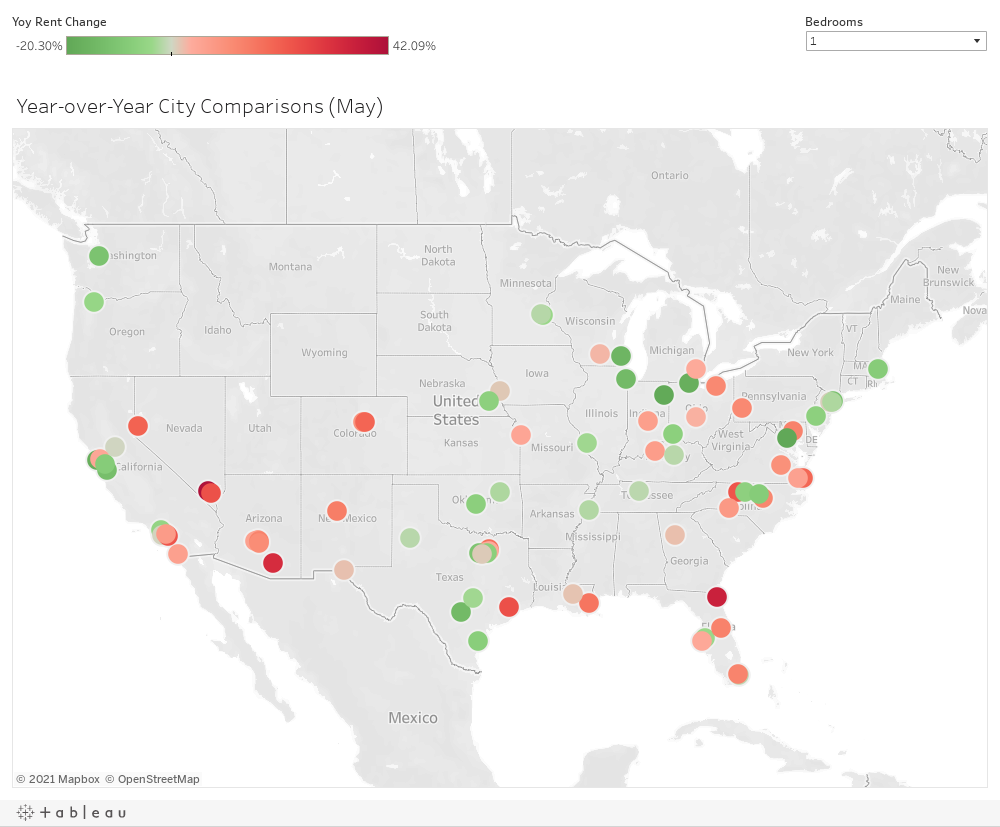
City average rent price trends
Getting more granular, let’s take a look at which cities are becoming more and less expensive. Our analysis looks at one- and two-bedroom apartments in the 100 most populated cities in the country. We eliminated cities with insufficient rental price data.
Take a look below for a full list of included cities and their price data.
One-bedroom city average rent price trends
The following cities have experienced the biggest increases in one-bedroom rent prices year-over-year. Two cities in California — Irvine and Santa Ana— are also in the 10 most expensive markets for one-bedroom apartments by rent prices. Winston-Salem, NC, Irvine, CA and Reno, NV all have a population of 300,000 or less.
- Las Vegas, NV (+42.1 percent)
- Jacksonville, FL (+35.5 percent)
- Tucson, AZ (+32.5 percent)
- Santa Ana, CA (+27.3 percent)
- Houston, TX (+24.3 percent)
- Henderson, NV (+24.1 percent)
- Winston-Salem, NC (+23.3 percent)
- Irvine, CA (+23.3 percent)
- Reno, NV (+20.4 percent)
- Aurora, CO (+19.8 percent)
The following cities have experienced the biggest decreases in one-bedroom rent prices year-over-year. Three cities — New York, NY; San Francisco, CA and San Jose, CA — are also in the 10 most expensive markets for one-bedroom apartments by rent prices. Fort Wayne, IN and Toledo, OH have populations of 300,000 or less.
- Washington, DC (-20.3 percent)
- Fort Wayne, IN (-19.8 percent)
- San Francisco, CA (-18.2 percent)
- Toledo, OH (-18.0 percent)
- Milwaukee, WI (-15.7 percent)
- San Antonio, TX (-14.3 percent)
- Chicago, IL (-14.1 percent)
- San Jose, CA (-13.0 percent)
- New York, NY (-12.2 percent)
- Seattle, WA (-11.3 percent)
Two-bedroom city average rent price trends
The following cities have experienced the biggest increases in two-bedroom rent prices year-over-year. One — Santa Ana, CA — is also in the 10 most expensive markets for two-bedroom apartments by rent prices. Buffalo, NY; Scottsdale, AZ; Hialeah, FL and Orlando, FL have a population of 300,000 or less.
- Henderson, NV (+46.7 percent)
- Tucson, AZ (+38.6 percent)
- Buffalo, NY (+37.8 percent)
- Scottsdale, AZ (+36.1 percent)
- Hialeah, FL (+33.7 percent)
- Detroit, MI (+32.9 percent)
- Las Vegas, NV (+32.4 percent)
- Santa Ana, CA (+26.2 percent)
- Orlando, FL (+25.9 percent)
- Denver, CO (+24.7 percent)
The following cities have experienced the biggest decreases in two-bedroom rent prices year-over-year. None of them make the 10 most expensive markets for one-bedroom apartments by rent prices. Two of them — St. Petersburg, FL and Fort Wayne, IN — have populations of 300,000 or less.
- St. Petersburg, FL (-37.9 percent)
- Seattle, WA (-33.9 percent)
- Fort Wayne, IN (-23.1 percent)
- Washington, DC (-16.4 percent)
- San Antonio, TX (-16.2 percent)
- Philadelphia, PA (-15.2 percent)
- Oklahoma City, OK (-14.2 percent)
- Fort Worth, TX (-14.1 percent)
- Austin, TX (-14.0 percent)
- Milwaukee, WI (-13.2 percent)
Overlap cities by average rent prices
Some cities reflect across-the-board increases or decreases in rent prices. We call these overlap cities.
Four cities in the top 10 have experienced year-over-year price increases in both one-bedroom and two-bedroom apartments:
Five cities in the top 10 have experienced year-over-year price decreases in both one-bedroom and two-bedroom apartments:
Average rent price trends in the 100 most populated cities
Here’s an expanded view of how rent prices are changing in the largest U.S. cities.
| Rank by Population | City, State | Population | 1-BR Avg Rent, May 2021 | 1-BR: 1-Year Change | 2-BR Avg Rent, May 2021 | 2-BR: 1-Year Change |
|---|---|---|---|---|---|---|
| 1 | New York, NY | 8,336,817 | $3,825 | -12.2% | $6,499 | 16.1% |
| 2 | Los Angeles, CA | 3,979,576 | $2,976 | -5.1% | $4,590 | 2.6% |
| 3 | Chicago, IL | 2,693,976 | $2,120 | -14.1% | $2,934 | -8.0% |
| 4 | Houston, TX | 2,320,268 | $1,543 | 24.3% | $1,606 | -2.6% |
| 5 | Phoenix, AZ | 1,680,992 | $1,453 | 6.3% | $1,713 | -1.8% |
| 6 | Philadelphia, PA | 1,584,064 | $1,903 | -6.6% | $2,306 | -15.2% |
| 7 | San Antonio, TX | 1,547,253 | $959 | -14.3% | $1,144 | -16.2% |
| 8 | San Diego, CA | 1,423,851 | $2,515 | 6.6% | $3,559 | 20.6% |
| 9 | Dallas, TX | 1,343,573 | $1,500 | -7.1% | $2,166 | -6.1% |
| 10 | San Jose, CA | 1,021,795 | $2,476 | -13.0% | $3,105 | -10.6% |
| 11 | Austin, TX | 978,908 | $1,459 | -3.3% | $1,502 | -14.0% |
| 12 | Jacksonville, FL | 911,507 | $1,479 | 35.5% | $1,443 | 10.6% |
| 13 | Fort Worth, TX | 909,585 | $1,152 | -10.8% | $1,365 | -14.1% |
| 14 | Columbus, OH | 898,553 | $1,216 | 3.4% | $1,582 | 15.9% |
| 15 | Charlotte, NC | 885,708 | $1,410 | 8.3% | $1,807 | 14.9% |
| 16 | San Francisco, CA | 881,549 | $3,188 | -18.2% | $4,674 | -7.8% |
| 17 | Indianapolis, IN | 876,384 | $1,214 | 6.9% | $1,430 | 2.4% |
| 18 | Seattle, WA | 753,675 | $2,204 | -11.3% | $2,639 | -33.9% |
| 19 | Denver, CO | 727,211 | $2,062 | 9.9% | $3,057 | 24.7% |
| 20 | Washington, DC | 705,749 | $2,199 | -20.3% | $3,075 | -16.4% |
| 21 | Boston, MA | 692,600 | $3,580 | -8.2% | $5,038 | -9.6% |
| 22 | El Paso, TX | 681,728 | $901 | 2.0% | $1,175 | 14.7% |
| 23 | Nashville, TN | 670,820 | $1,747 | -1.4% | $2,158 | -3.5% |
| 24 | Detroit, MI | 670,031 | $1,593 | 4.3% | $2,308 | 32.9% |
| 25 | Oklahoma City, OK | 655,057 | $706 | -7.0% | $853 | -14.2% |
| 26 | Portland, OR | 654,741 | $1,671 | -4.5% | $2,246 | -4.3% |
| 27 | Las Vegas, NV | 651,319 | $1,730 | 42.1% | $2,014 | 32.4% |
| 28 | Memphis, TN | 651,073 | $934 | -2.1% | $939 | -12.0% |
| 29 | Louisville, KY | 617,638 | $1,168 | 7.4% | $1,209 | 0.1% |
| 30 | Baltimore, MD | 593,490 | $1,859 | 13.8% | $1,925 | 9.2% |
| 31 | Milwaukee, WI | 590,157 | $1,127 | -15.7% | $1,523 | -13.2% |
| 32 | Albuquerque, NM | 560,513 | $1,062 | 14.8% | $1,054 | -6.5% |
| 33 | Tucson, AZ | 548,073 | $1,073 | 32.5% | $1,425 | 38.6% |
| 34 | Fresno, CA | 531,576 | N/A | N/A | N/A | N/A |
| 35 | Mesa, AZ | 518,012 | $1,161 | 13.7% | $1,559 | 18.2% |
| 36 | Sacramento, CA | 513,624 | $2,142 | 0.1% | $2,756 | 15.5% |
| 37 | Atlanta, GA | 506,811 | $1,651 | 2.1% | $2,068 | -1.0% |
| 38 | Kansas City, MO | 495,327 | $1,290 | 5.3% | $1,714 | 10.4% |
| 39 | Colorado Springs, CO | 478,221 | N/A | N/A | N/A | N/A |
| 40 | Omaha, NE | 478,192 | $972 | 1.3% | $1,298 | 13.9% |
| 41 | Raleigh, NC | 474,069 | $1,328 | 12.8% | $1,339 | 7.6% |
| 42 | Miami, FL | 467,963 | $2,401 | -1.1% | $2,810 | -6.8% |
| 43 | Long Beach, CA | 462,628 | $1,867 | 0.3% | $2,253 | -0.8% |
| 44 | Virginia Beach, VA | 449,974 | $1,615 | 19.4% | $1,718 | 17.4% |
| 45 | Oakland, CA | 433,031 | $3,273 | 5.2% | $4,514 | 12.6% |
| 46 | Minneapolis, MN | 429,606 | $1,415 | -1.8% | $1,959 | 3.4% |
| 47 | Tulsa, OK | 401,190 | $630 | -2.4% | $801 | -8.4% |
| 48 | Tampa, FL | 399,700 | $1,289 | -3.7% | $1,643 | -6.8% |
| 49 | Arlington, TX | 398,854 | $1,066 | 1.1% | $1,483 | 11.2% |
| 50 | New Orleans, LA | 390,144 | $1,782 | 16.6% | $2,619 | 22.0% |
| 51 | Wichita, KS | 389,938 | N/A | N/A | $555 | -10.8% |
| 52 | Bakersfield, CA | 384,145 | N/A | N/A | N/A | N/A |
| 53 | Cleveland, OH | 381,009 | $1,425 | 12.2% | $1,912 | 7.6% |
| 54 | Aurora, CO | 379,289 | $1,713 | 19.8% | $1,964 | 18.5% |
| 55 | Anaheim, CA | 350,365 | $2,311 | 7.8% | $2,196 | -12.9% |
| 56 | Honolulu, HI | 345,064 | N/A | N/A | N/A | N/A |
| 57 | Santa Ana, CA | 332,318 | $2,598 | 27.3% | $3,184 | 26.2% |
| 58 | Riverside, CA | 331,360 | N/A | N/A | N/A | N/A |
| 59 | Corpus Christi, TX | 326,586 | $900 | -7.5% | $1,264 | 10.7% |
| 60 | Lexington, KY | 323,152 | $874 | -1.6% | $982 | 1.0% |
| 61 | Henderson, NV | 320,189 | $1,678 | 24.1% | $2,091 | 46.7% |
| 62 | Stockton, CA | 312,697 | N/A | N/A | N/A | N/A |
| 63 | Saint Paul, MN | 308,096 | $1,388 | -4.0% | $1,865 | -2.3% |
| 64 | Cincinnati, OH | 303,940 | $991 | -6.9% | $1,239 | -10.7% |
| 65 | Saint Louis, MO | 300,576 | $1,805 | -3.3% | $2,001 | -7.4% |
| 66 | Pittsburgh, PA | 300,286 | $1,696 | 12.2% | $1,755 | -0.1% |
| 67 | Greensboro, NC | 296,710 | $786 | -6.5% | $1,029 | -9.6% |
| 68 | Lincoln, NE | 289,102 | $1,027 | -6.7% | $1,422 | 13.1% |
| 69 | Anchorage, AK | 288,000 | N/A | N/A | N/A | N/A |
| 70 | Plano, TX | 287,677 | $1,657 | 17.6% | $2,043 | 9.5% |
| 71 | Orlando, FL | 287,442 | $1,714 | 13.8% | $2,242 | 25.9% |
| 72 | Irvine, CA | 287,401 | $2,785 | 23.3% | $3,200 | 18.4% |
| 73 | Newark, NJ | 282,011 | $2,019 | 0.8% | N/A | N/A |
| 74 | Durham, NC | 278,993 | $1,163 | -8.3% | $1,468 | -5.2% |
| 75 | Chula Vista, CA | 274,492 | N/A | N/A | N/A | N/A |
| 76 | Toledo, OH | 272,779 | $682 | -18.0% | $985 | 12.0% |
| 77 | Fort Wayne, IN | 270,402 | $693 | -19.8% | $801 | -23.1% |
| 78 | Saint Petersburg, FL | 265,351 | $1,796 | 4.7% | $1,262 | -37.9% |
| 79 | Laredo, TX | 262,491 | N/A | N/A | N/A | N/A |
| 80 | Jersey City, NJ | 262,075 | $2,887 | -2.4% | $3,981 | -3.7% |
| 81 | Chandler, AZ | 261,165 | $1,459 | 11.3% | $1,801 | 11.8% |
| 82 | Madison, WI | 259,680 | $1,218 | 2.9% | $1,704 | 12.0% |
| 83 | Lubbock, TX | 258,862 | $713 | -1.6% | $870 | -6.2% |
| 84 | Scottsdale, AZ | 258,069 | $2,035 | 10.2% | $2,849 | 36.1% |
| 85 | Reno, NV | 255,601 | $1,618 | 20.4% | $2,109 | 22.4% |
| 86 | Buffalo, NY | 255,284 | N/A | N/A | $1,797 | 37.8% |
| 87 | Gilbert, AZ | 254,114 | N/A | N/A | N/A | N/A |
| 88 | Glendale, AZ | 252,381 | N/A | N/A | N/A | N/A |
| 89 | North Las Vegas, NV | 251,974 | N/A | N/A | N/A | N/A |
| 90 | Winston-Salem, NC | 247,945 | $994 | 23.3% | $1,217 | 22.1% |
| 91 | Chesapeake, VA | 244,835 | N/A | N/A | N/A | N/A |
| 92 | Norfolk, VA | 242,742 | $1,326 | 6.2% | $1,539 | 12.1% |
| 93 | Fremont, CA | 241,110 | $2,238 | -8.3% | $2,670 | -12.4% |
| 94 | Garland, TX | 239,928 | $1,225 | 4.2% | $1,639 | 3.7% |
| 95 | Irving, TX | 239,798 | $1,483 | 4.5% | $1,831 | 4.8% |
| 96 | Hialeah, FL | 233,339 | $1,757 | 13.5% | $2,455 | 33.7% |
| 97 | Richmond, VA | 230,436 | $1,288 | 10.3% | $1,364 | -9.8% |
| 98 | Boise, ID | 228,959 | N/A | N/A | N/A | N/A |
| 99 | Spokane, WA | 222,081 | N/A | N/A | N/A | N/A |
| 100 | Baton Rouge, LA | 220,236 | $986 | 1.8% | $1,161 | 8.8% |
Rental industry trends
In addition to rent price trends, we highlight a few industry trends that may be having an impact on the overall rental market.
1. Rent payments reflect resilience, but challenges remain
The National Multifamily Housing Council (NMHC) released hopeful guidance about the state of multi-family housing as the nation continues to emerge from the pandemic. At the same time, the council acknowledged potential challenges ahead — including rising material costs and growing labor shortages in the construction industry.
Nearly 95 percent of rent payments were made in May 2021 and 77 percent of June rent payments had been made by June 6. At present, a national eviction moratorium is in place through June 30.
2. Annual housing report highlights price hikes, disparities
On June 16, Harvard’s Joint Center for Housing Studies released its annual State of the Nation’s Housing report for 2021. The report documents the record inventory lows that are currently driving home prices upward and adding a fresh round of gas to the affordability fire.
Increases in home prices have been outpacing income gains for some time now, and as of this year, the price-to-income ratio is at its highest level since 2006. That means that many would-be homebuyers are potentially being left behind as the price of entry into homeownership — the accumulation of a down payment and closing costs — rises while those who can afford to buy race into the market.
Although the homeownership gap is narrowing between households of color and white households, the report points out that the gap remains significant — and all households facing lower median incomes and/or other sizeable expenses, such as student loans, remain at risk of being unable to afford homeownership.
About this report
Our June 2021 Rent Report highlights year-over-year rent trends and price fluctuations that renters may experience in various parts of the United States. We compare rent prices for a studio, one-bedroom, two-bedroom and three-bedroom apartments to determine which unit types and which of the country’s most populated cities are becoming more affordable or more expensive for renters.
We also offer a key few takeaways and insights — such as whether or not markets with the largest rent increases are also those with the most expensive rent prices, and which regions of the country are most favorable to renters right now.
Methodology
To determine average rent prices, we started with May 2021 data from Apartment Guide and Rent.com’s multifamily rental property inventory. From there, we evaluated changes seen since May 2020. Monthly prices are based on the average price for that respective month.
We used a weighted average formula that more accurately represents price availability for each individual unit type and reduces the influence of seasonality on rent prices in specific markets.
The U.S. Census divides the country into four geographic regions: Northeast (Connecticut, Maine, Massachusetts, New Hampshire, New Jersey, New York, Pennsylvania, Rhode Island, and Vermont); Midwest (Illinois, Indiana, Iowa, Kansas, Michigan, Minnesota, Missouri, Nebraska, North Dakota, Ohio, South Dakota and Wisconsin); South (Alabama, Arkansas, Delaware, Florida, Georgia, Kentucky, Louisiana, Maryland, Mississippi, North Carolina, Oklahoma, South Carolina, Tennessee, Texas, Virginia, District of Columbia and West Virginia) and West (Alaska, Arizona, California, Colorado, Idaho, Montana, Nevada, New Mexico, Hawaii, Utah, Washington and Wyoming).
The top 100 cities in our analysis were determined by 2019 U.S. Census Bureau population estimates. We excluded cities with insufficient inventory in each time period to eliminate potential outliers or highly volatile data caused by a small sample size. Rent price increases and decreases per time period are based on the percentage change of apartment rental prices from May 2020.
The rent information included in this article is used for illustrative purposes only. The data contained herein do not constitute financial advice or a pricing guarantee for any apartment.